SYSTEMATIC MULTI-MARKET PORTFOLIO
Five models.
One portfolio.
Automated models across four currency pairs and gold, operating on one shared account.
Trading floor
How the portfolio works.
Five automated models make their own trading decisions within one shared account.
- EURUSD
- GBPUSD
- AUDJPY
- USDJPY
- XAUUSD / Gold
Independent trading decisions. Shared capital and portfolio oversight.
Each model has its own rules for selecting opportunities and executing trades. The portfolio brings their results together under one account-level risk framework.
Trading floor
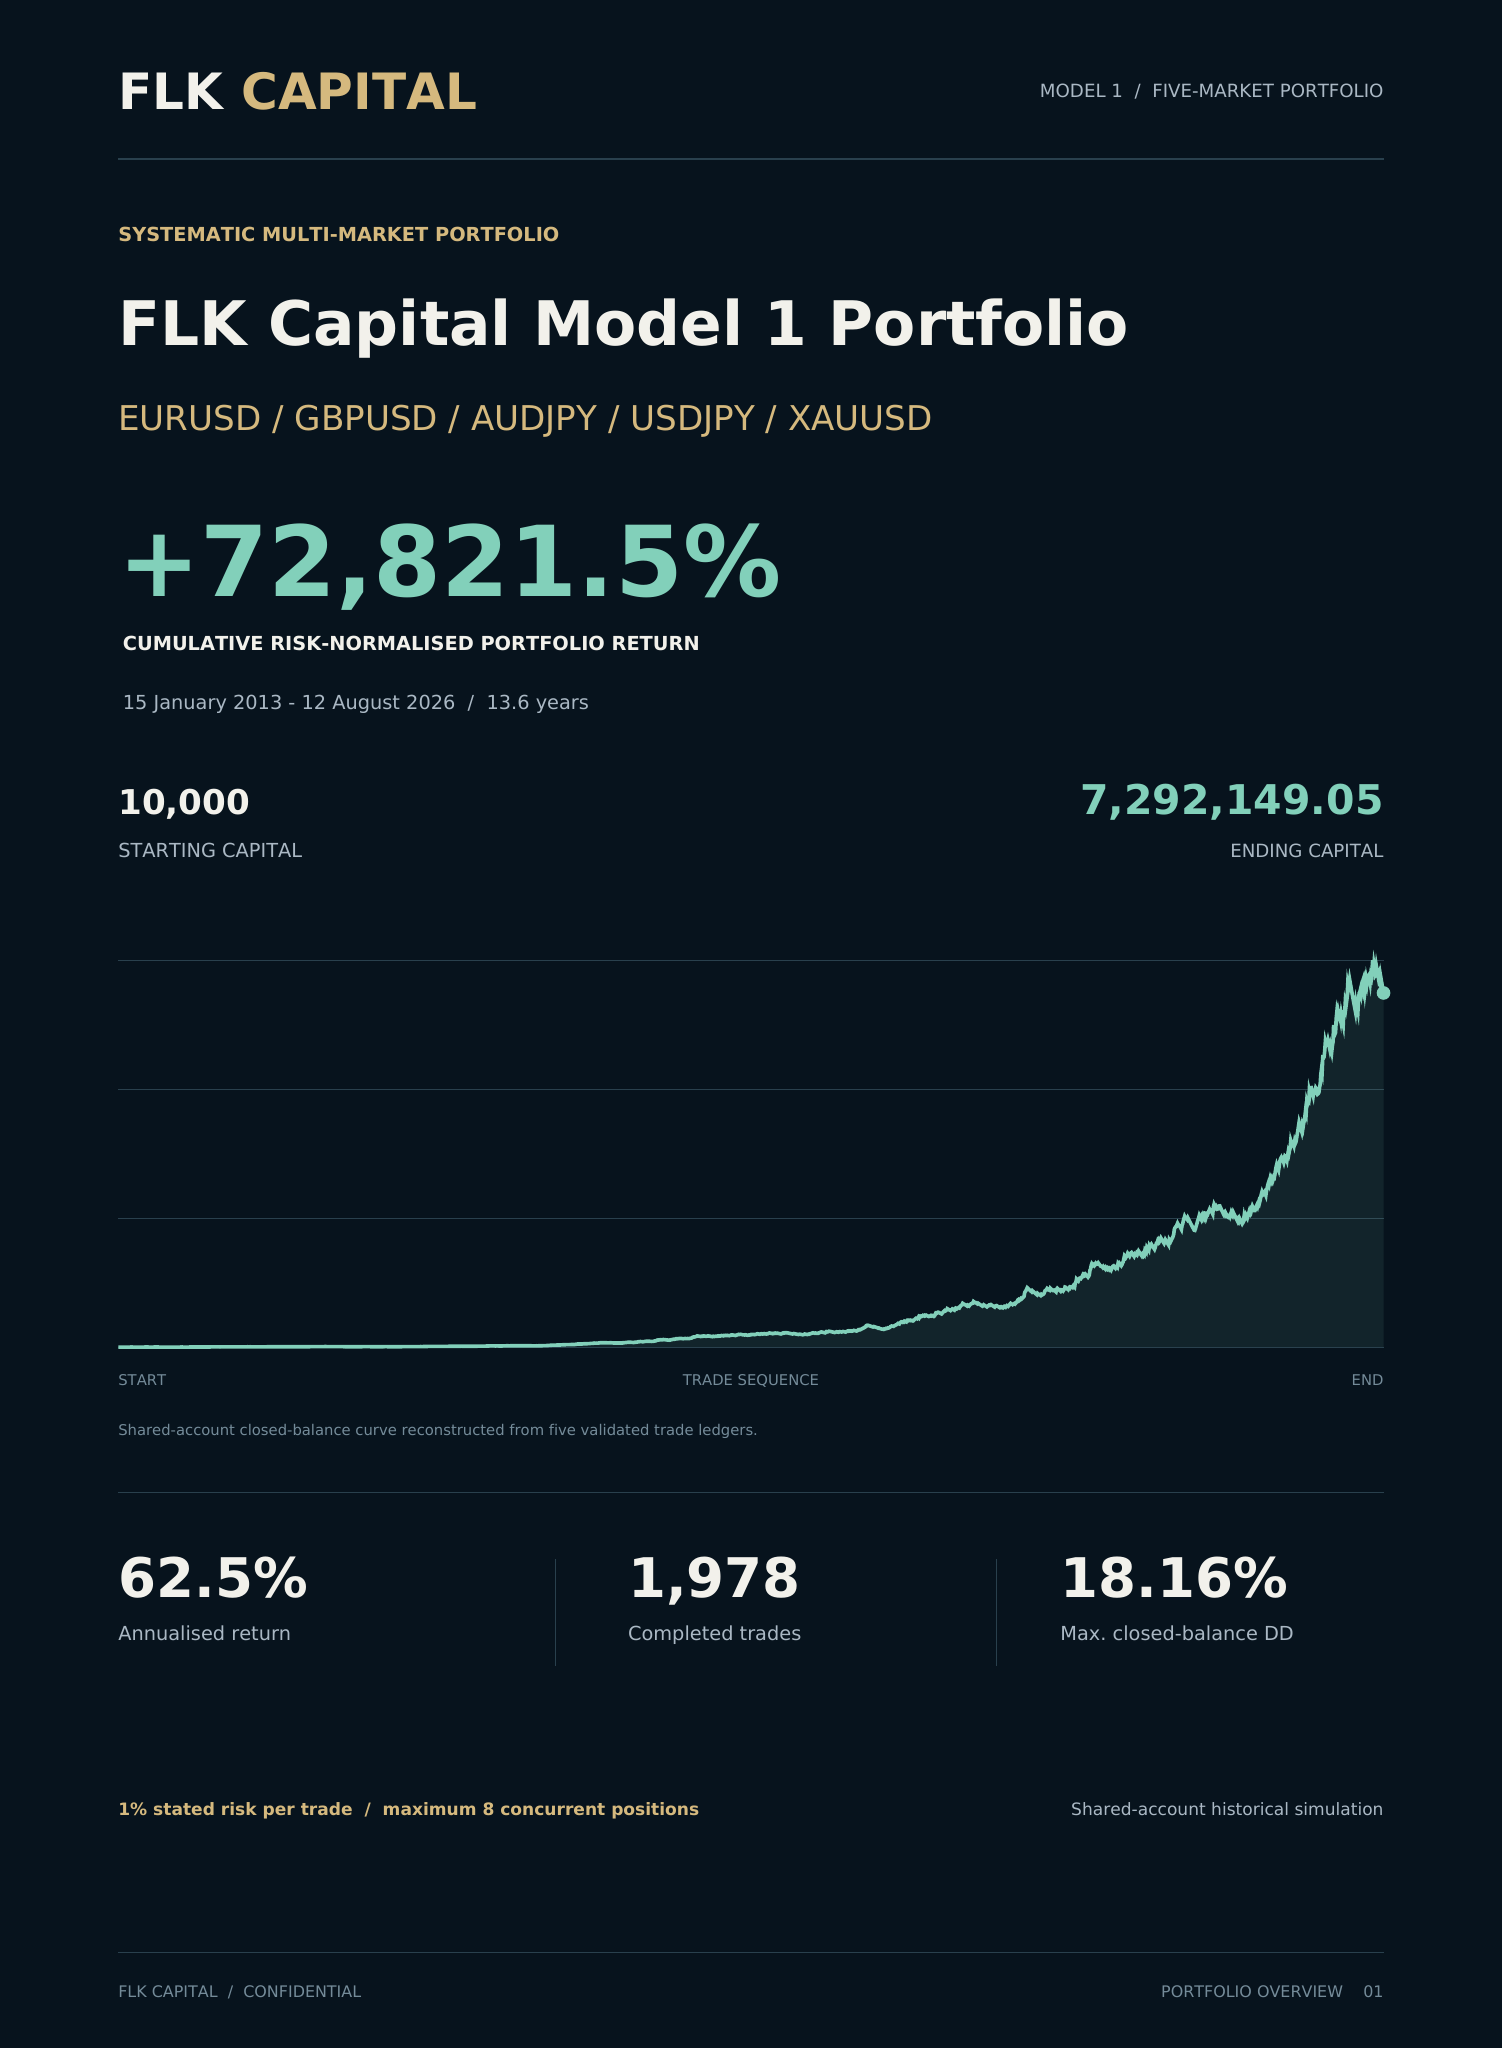
13.6 years of simulated results.
Historical simulation · 15 Jan 2013 – 12 Aug 2026
Shared-account simulation. Before separately charged investor fees.
The annualised return summarises the compounded growth of the reconstructed shared account over the full simulation. These are simulated historical results, not a live investment track record.
117 of 164 months were positive. All 14 calendar periods were positive; 2013 and 2026 are partial periods. Historical results do not guarantee future performance.
Market desks
Why combine different markets?
Adding gold raised return and reduced drawdown in the simulation.
2013–2026Four FX
modelsWith
gold
Monthly model outcomes showed little co-movement: +0.02 average pairwise correlation.
Both portfolios were simulated over 15 Jan 2013 – 12 Aug 2026, using the same shared-account framework. This historical comparison does not establish how either portfolio will perform in future.
The +0.02 figure is the average pairwise correlation of monthly model results measured in R, a unit of trade risk. Individual correlations ranged from −0.09 to +0.13. Low historical correlation does not mean the models are independent or cannot lose together.
Share of simulated profit
Each model’s contribution to the combined simulation’s profit. These figures are not portfolio allocations.
Portfolio control
Understanding portfolio risk.
Historical simulation · 15 Jan 2013 – 12 Aug 2026
Measured on closed trades. Open-position losses are not captured by this drawdown figure.
Closed balance changes when trades close. It does not show the account’s equity while positions remain open. The supplied ledgers do not include intratrade equity, so the 18.16% figure is not a measure of maximum intratrade equity drawdown.
The reconstruction allocated 1% of the closed account balance at each trade’s entry. This is a stated sizing assumption, not a guarantee that a realised loss cannot exceed it. Up to eight positions could be open at once.
The largest closed-balance decline ran from 11 March to 12 April 2022 and recovered by 12 May 2022. All 1,978 historical trades were accepted; the position cap rejected none.
INVESTOR RELATIONS
Explore the portfolio in detail.
START WITH THE PORTFOLIO
Five-market portfolio report
The combined results, risk framework and methodology in one report.
Download portfolio PDFIndividual market reports
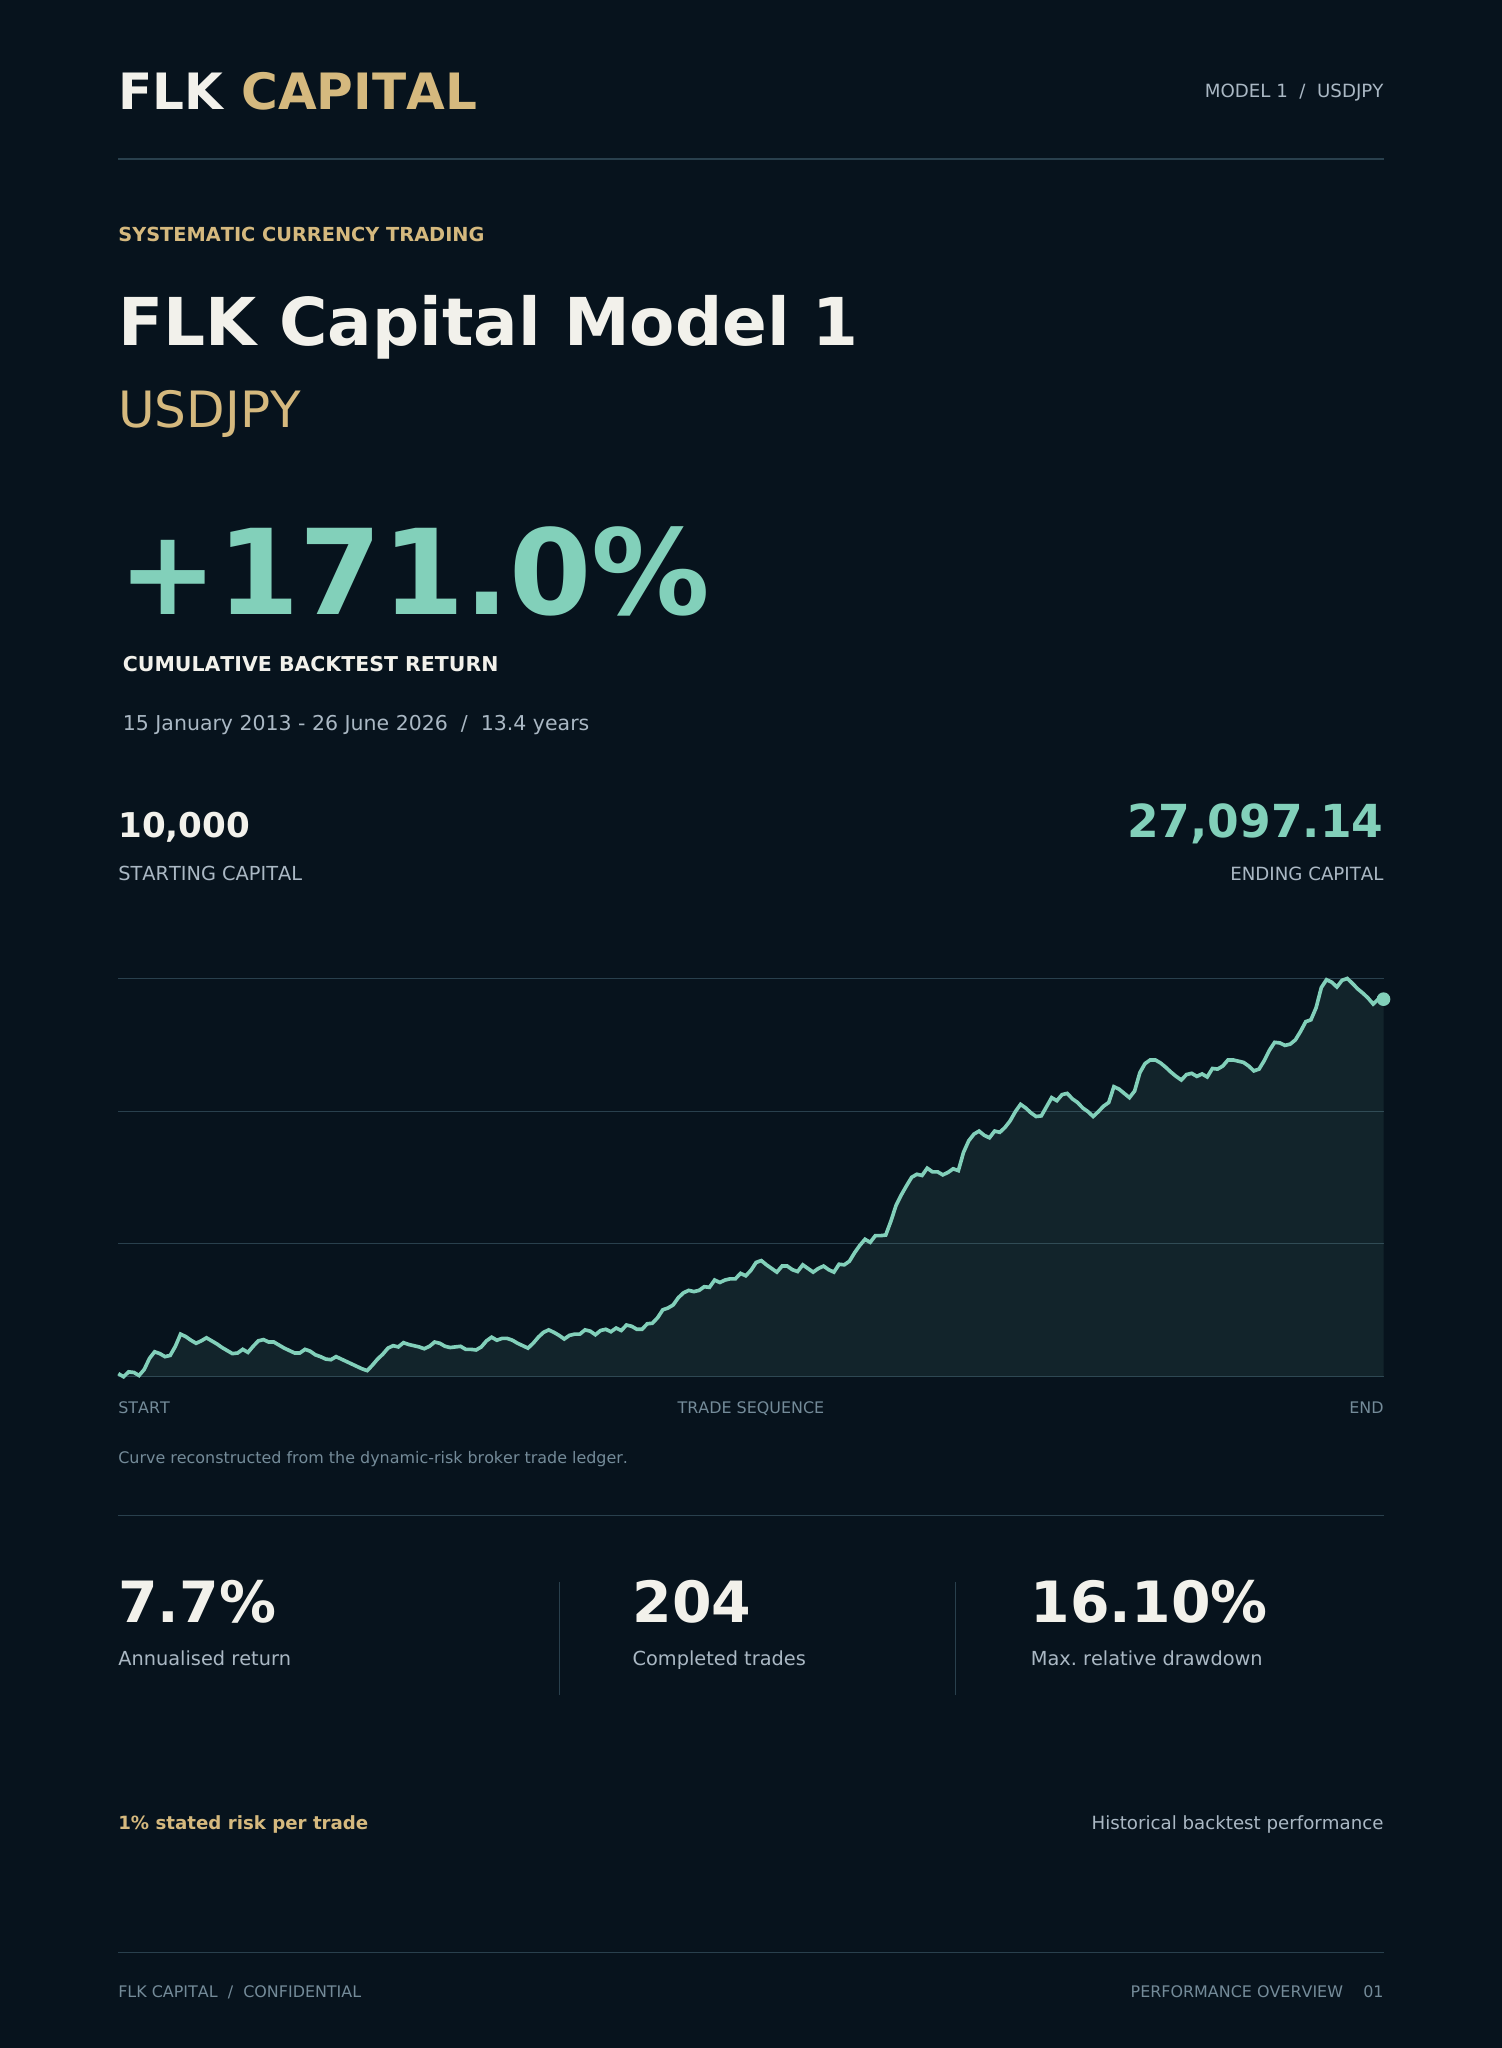
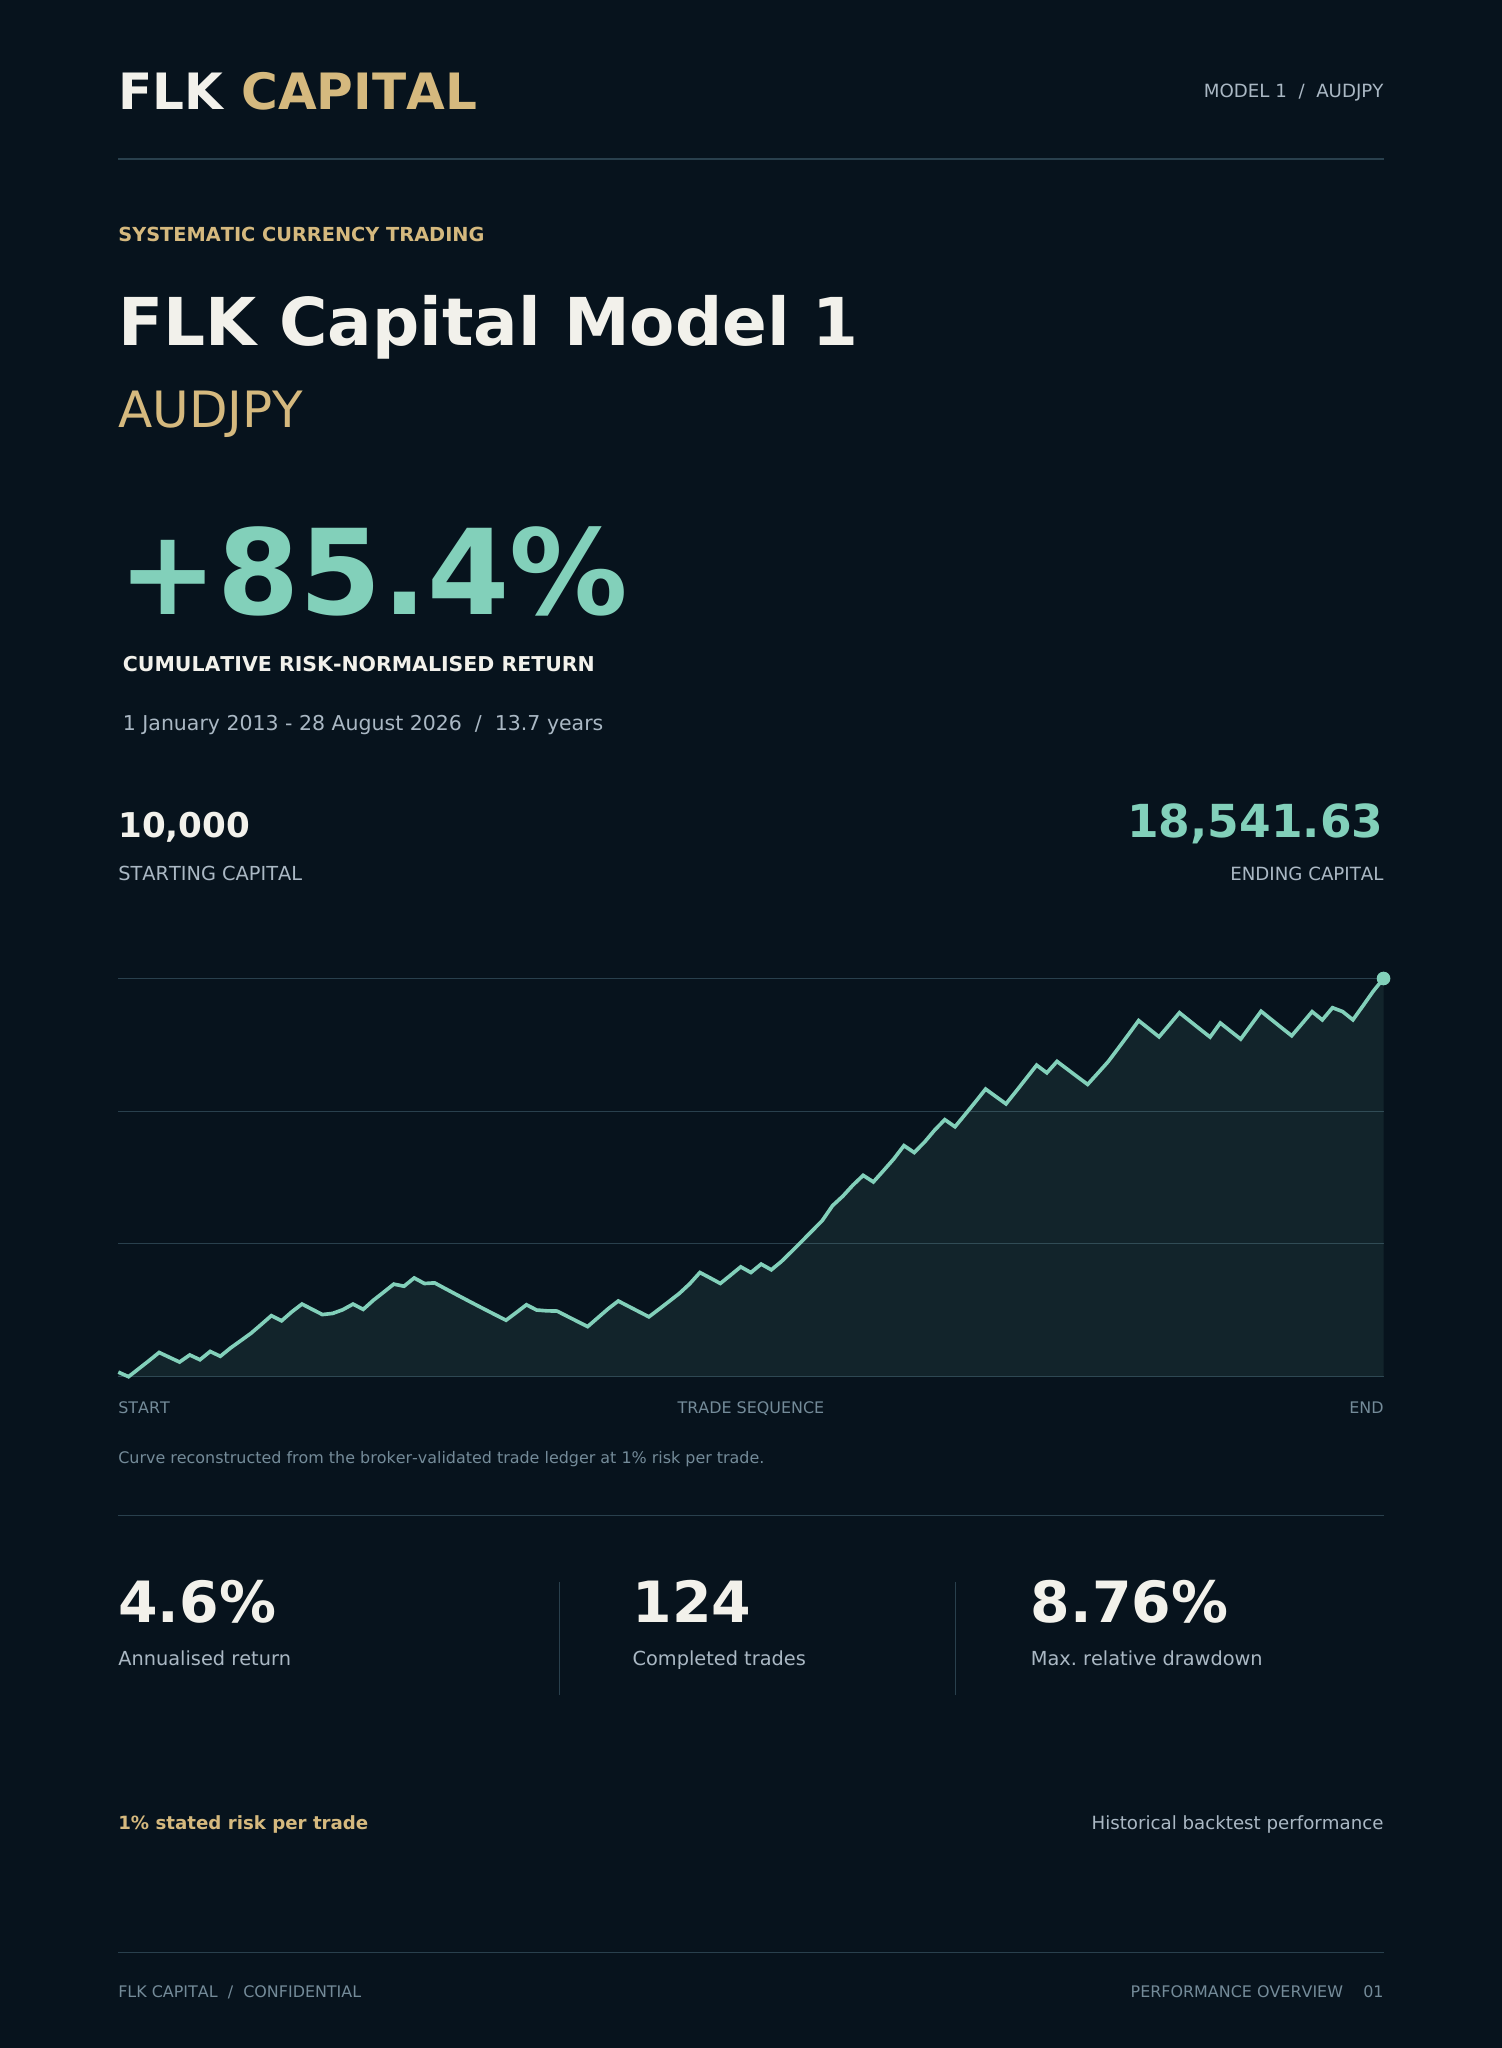
Historical simulated results are not a live investment track record or a guarantee of future performance. Returns are before separately charged investor fees. Capital is at risk.